Portfolio Trading
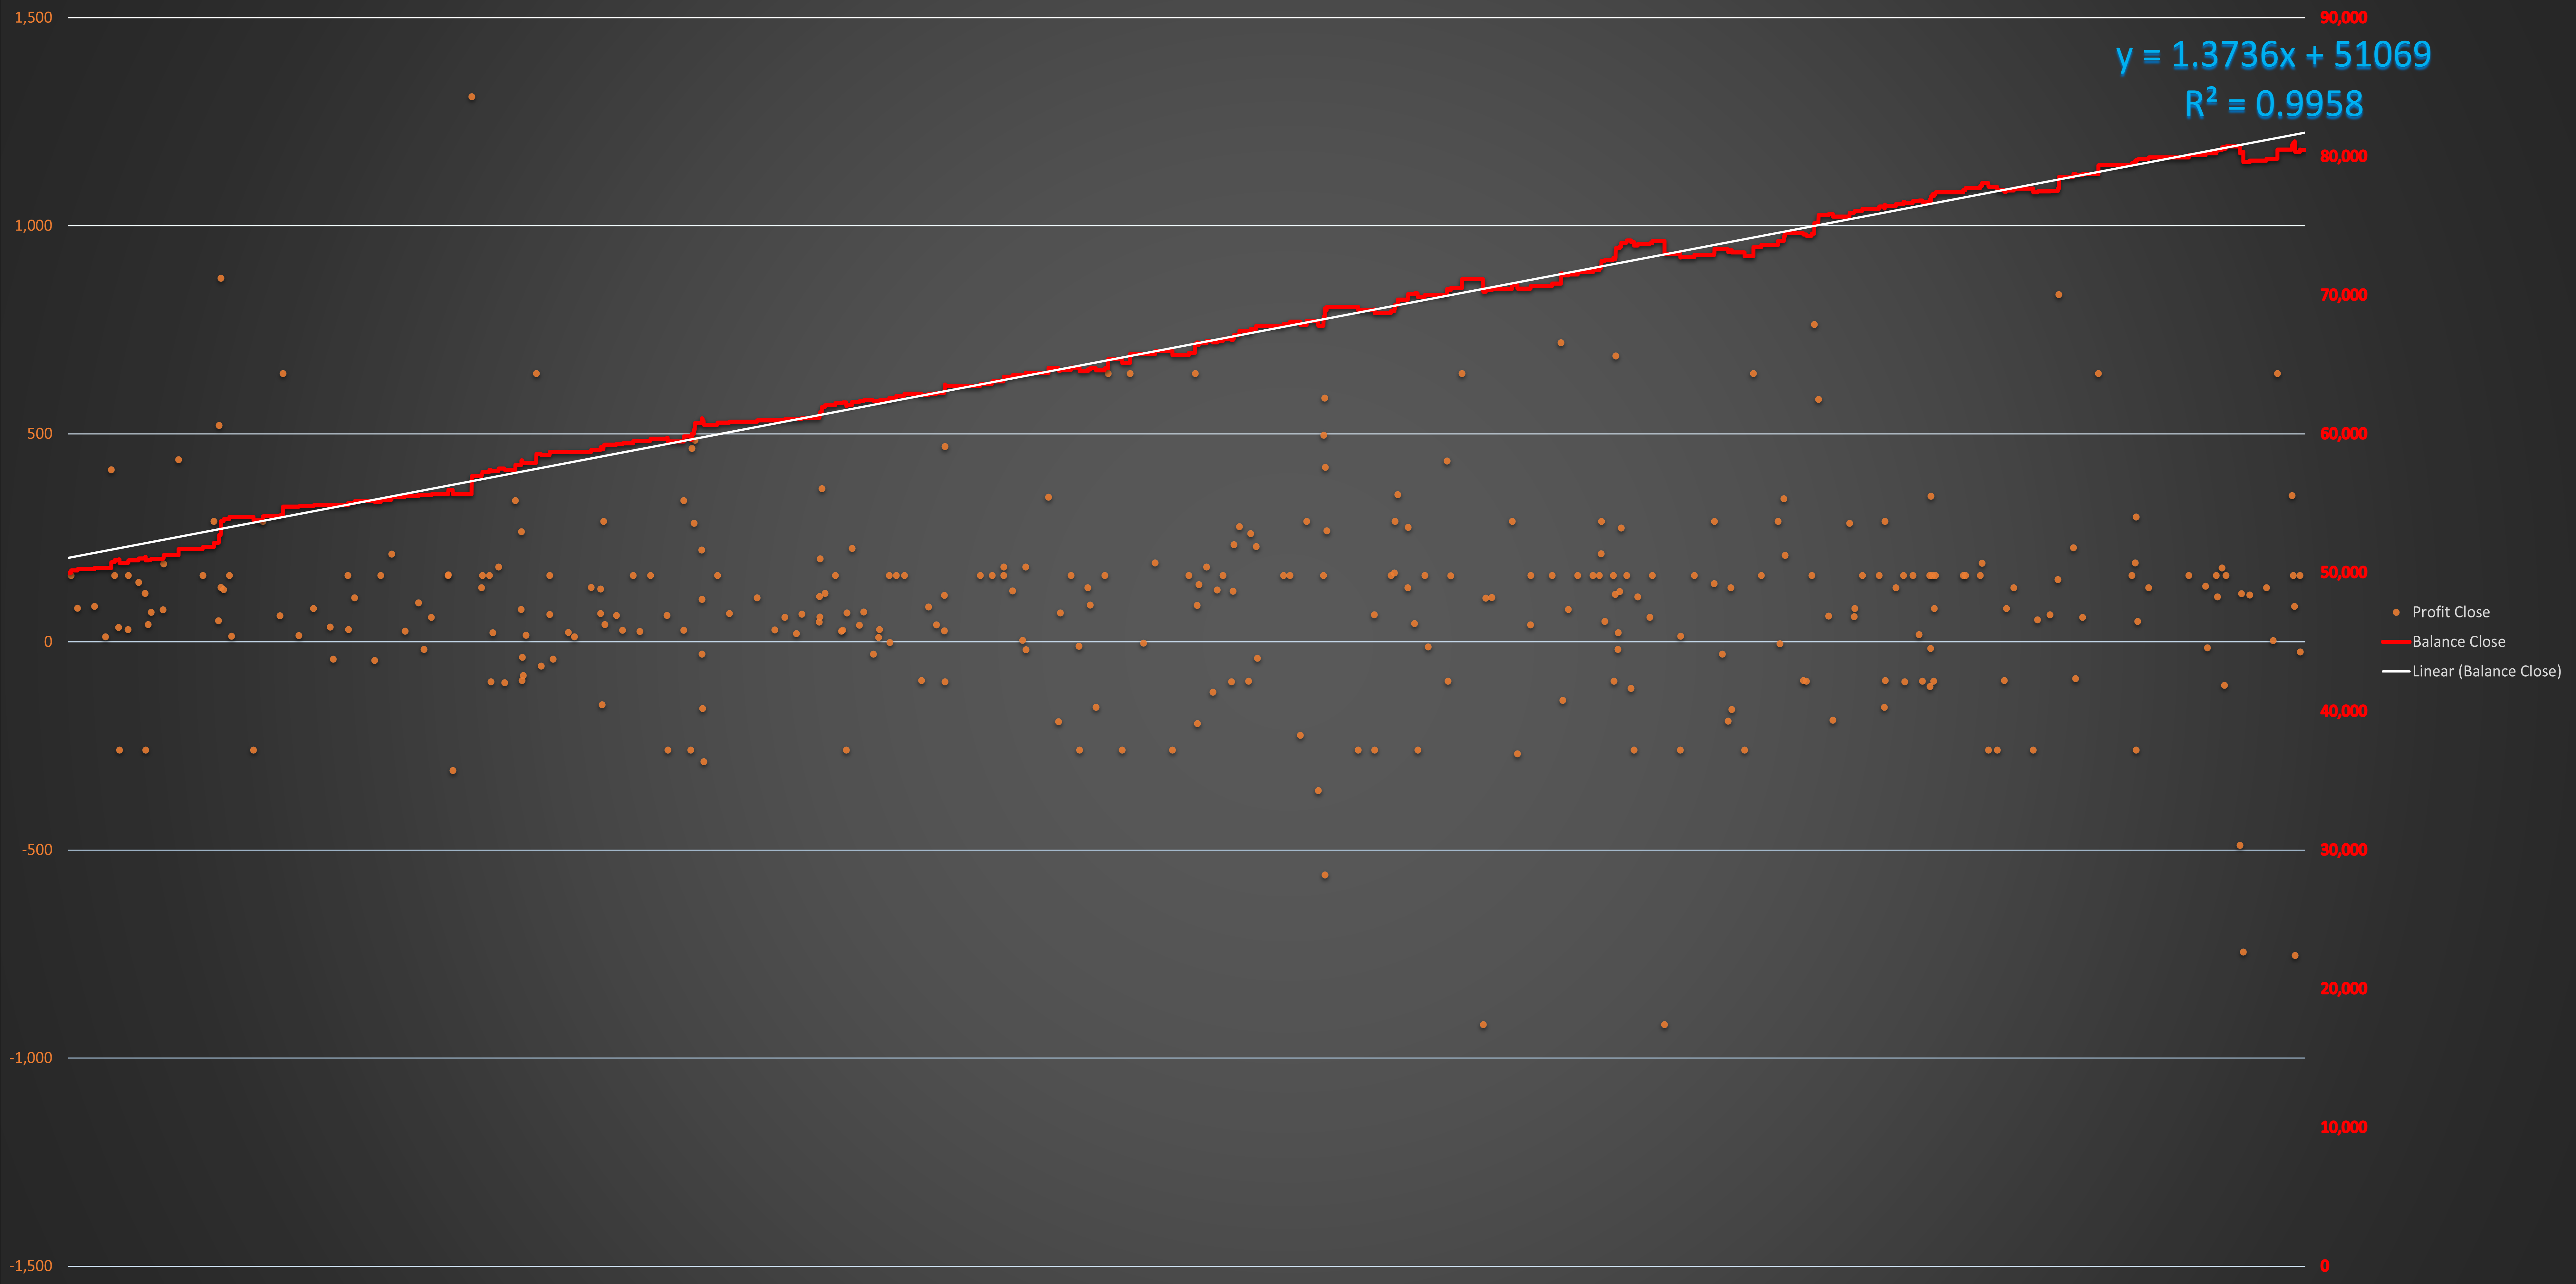
Each of these expert advisors has their strategy. These expert advisors with their unique trade size and trade frequency are also capable of working in harmony with each other in accordance with modern portfolio theory. The totals of the trade results of these 10 portfolio elements, which have very low correlation coefficients, between 2020 and 2023 over the standard lot are shown in the table below. We would like to draw your attention to the fact that all of the robots whose performances are displayed in this table were coded before 2020. In particular, these results do not include curve fittings.

The balance line collected by each trade, indicated by the orange dots, is shown in red in the table.
As a result, having an R² value over 0.995 is proof that the portfolio is stable and reliable with a low standard deviation. However, also the angle of the trendline is above 54⁰. This angle is the reflection in the table of the doubling time speed, which we, as Laplace Robots, accept as a profitability target indicator. In other words, as the angle value increases, the doubling time will be shortened.
The opportunity to test and review each of these high-performance expert advisors, which we are trying to briefly mention, is available here after free registration. You can download a free demo expert advisor after registration, so you can strengthen the reliability of Laplace Robot by making your own backtests without purchasing.
